United States presidential election
| This article is part of a series on the |
| Politics of the United States of America |
|---|
 |
Federal Government
|
Legislature
|
Executive
|
Judiciary
|
Elections
|
Political parties
|
Federalism
|
|
The election of President and Vice President of the United States is an indirect election in which citizens of the United States who are registered to vote in one of the 50 U.S. states or in Washington, D.C. cast ballots not directly for those offices, but instead for members of the U.S. Electoral College, known as electors. These electors then in turn cast direct votes, known as electoral votes, for President, and for Vice President. The candidate who receives an absolute majority of electoral votes (at least 270 out of a total of 538, since the Twenty-Third Amendment granting voting rights to citizens of Washington, D.C.) is then elected to that office. If no candidate receives an absolute majority of the votes for President, the House of Representatives chooses the winner; if no one receives an absolute majority of the votes for Vice President, then the Senate chooses the winner.
The Electoral College and its procedure are established in the U.S. Constitution by Article II, Section 1, Clauses 2 and 4; and the Twelfth Amendment (which replaced Clause 3 after its ratification in 1804). Under Clause 2, each of the states casts as many electoral votes as the total number of its Senators and Representatives in Congress, while, per the Twenty-third Amendment ratified in 1961, Washington, D.C. casts the same number of electoral votes as the least-represented state, which is three. Also under Clause 2, the manner for choosing electors is determined by each state legislature, not directly by the federal government. Many state legislatures previously selected their electors directly, but over time all of them switched to using the popular vote to help determine electors, which persists today. Once chosen, electors generally cast their electoral votes for the candidate who won the plurality in their state, but at least 21 states do not have provisions that specifically address this behavior; those who vote in opposition to the plurality are known as "faithless" or "unpledged electors".[1] In modern times, faithless and unpledged electors have not affected the ultimate outcome of an election, so the results can generally be determined based on the state-by-state popular vote.
Presidential elections occur quadrennially with registered voters casting their ballots on Election Day, which since 1845 has been the first Tuesday after November 1.[2][3][4] This date coincides with the general elections of various other federal, state, and local races; since local governments are responsible for managing elections, these races typically all appear on one ballot. The Electoral College electors then formally cast their electoral votes on the first Monday after December 12 at their respective state capitals. Congress then certifies the results in early January, and the presidential term begins on Inauguration Day, which since the passage of the Twentieth Amendment has been set at January 20.
The nomination process, consisting of the primary elections and caucuses and the nominating conventions, was not specified in the Constitution, but was developed over time by the states and political parties. These primary elections are generally held between January and June before the general election in November, while the nominating conventions are held in the summer. Though not codified by law, political parties also follow an indirect election process, where voters in the 50 U.S. states, Washington, D.C., and U.S. territories, cast ballots for a slate of delegates to a political party's nominating convention, who then in turn elect their party's presidential nominee. Each party may then choose a vice presidential running mate to join the ticket, which is either determined by choice of the nominee or by a second round of voting. Because of changes to national campaign finance laws since the 1970s regarding the disclosure of contributions for federal campaigns, presidential candidates from the major political parties usually declare their intentions to run as early as the spring of the previous calendar year before the election (almost 18 months before Inauguration Day).[5]

A 2016 general election ballot, listing the presidential and vice presidential candidates
Contents
1 History
2 Procedure
2.1 Eligibility requirements
2.2 Nominating process
2.3 The popular vote on Election Day
2.4 Electoral college
2.5 Election calendar
3 Trends
3.1 Previous experience
3.2 Technology and media
4 Criticisms
4.1 Proposed changes to the election process
5 Electoral college results
6 Voter turnout
7 Financial disclosures
8 Presidential coattails
8.1 Comparison with other U.S. general elections
9 See also
10 Notes
11 Further reading
12 External links
History
Article Two of the United States Constitution originally established the method of presidential elections, including the Electoral College. This was a result of a compromise between those constitutional framers who wanted the Congress to choose the president, and those who preferred a national popular vote.[6]
Each state is allocated a number of electors that is equal to the size of its delegation in both houses of Congress combined. With the ratification of the 23rd Amendment to the Constitution in 1961, the District of Columbia is also granted a number of electors, equal to the number of those held by the least populous state. However, U.S. territories are not represented in the Electoral College.
Constitutionally, the manner for choosing electors is determined within each state by its legislature; Article II, Section 1, Clause 2 states that each state shall appoint electors "in such Manner as the Legislature Thereof May Direct."[7] During the first presidential election in 1789, only six of the 13 original states chose electors by any form of popular vote.[8] Gradually throughout the years, the states began conducting popular elections to choose their slate of electors. In 1800, only five of the 16 states chose electors by a popular vote; by 1824, after the rise of Jacksonian democracy, the proportion of states that chose electors by popular vote had sharply risen to 18 out of 24 states.[9] This gradual movement toward greater democratization coincided with a gradual decrease in property restrictions for the franchise.[9] By 1840, only one of the 26 states (South Carolina) still selected electors by the state legislature.[10]
Under the original system established by Article Two, electors could cast two votes to two different candidates for president. The candidate with the highest number of votes (provided it was a majority of the electoral votes) became the president, and the second-place candidate became the vice president. This presented a problem during the presidential election of 1800 when Aaron Burr received the same number of electoral votes as Thomas Jefferson and challenged Jefferson's election to the office. In the end, Jefferson was chosen as the president because of Alexander Hamilton's influence in the House of Representatives.
In response to the 1800 election, the 12th Amendment was passed, requiring electors to cast two distinct votes: one for President and another for Vice President. While this solved the problem at hand, it ultimately had the effect of lowering the prestige of the Vice Presidency, as the office was no longer for the leading challenger for the Presidency. The separate ballots for President and Vice President became something of a moot issue later in the 19th century when it became the norm for popular elections to determine a state's Electoral College delegation. Electors chosen this way are pledged to vote for a particular presidential and vice presidential candidate (offered by the same political party). So, while the Constitution says that the President and Vice President are chosen separately, in practice they are chosen together.
The 12th Amendment also established rules when no candidate wins a majority vote in the Electoral College. In the presidential election of 1824, Andrew Jackson received a plurality, but not a majority, of electoral votes cast. The election was thrown to the House of Representatives, and John Quincy Adams was elected to the presidency. A deep rivalry resulted between Andrew Jackson and House Speaker Henry Clay, who had also been a candidate in the election.
Since 1824, aside from the occasional "faithless elector", the popular vote determines the winner of a presidential election by determining the electoral vote, as each state or district's popular vote determines its electoral college vote. Although the nationwide popular vote does not directly determine the winner of a presidential election, it does strongly correlate with who is the victor. In 53 of the 58 total elections held so far (about 91 percent), the winner of the national popular vote has also carried the Electoral College vote. The winners of the nationwide popular vote and the Electoral College vote differ only in close elections. In highly competitive elections, candidates focus on turning out their vote in the contested swing states critical to winning an electoral college majority, so they do not try to maximize their popular vote by real or fraudulent vote increases in one-party areas.[11]
However, candidates can fail to get the most votes in the nationwide popular vote in a Presidential election and still win that election. In the 1824 election, Jackson won the popular vote, but no one received the majority of electoral votes. According to the 12th Amendment in the Constitution, the House of Representatives must choose the president out of the top three people in the election. Clay had come fourth, so he threw his support to Adams, who then won. Because Adams later named Clay his Secretary of State, Jackson's supporters claimed that Adams gained the presidency by making a deal with Clay. Charges of a "corrupt bargain" followed Adams through his term.

Comparison of the popular vote totals since 1900.
Republican
Democrat
All other candidates together
Then in 1876, 1888, 2000, and 2016, the winner of electoral vote lost the popular vote outright. Numerous constitutional amendments have been submitted seeking to replace the Electoral College with a direct popular vote, but none has ever successfully passed both Houses of Congress. Another alternate proposal is the National Popular Vote Interstate Compact, an interstate compact whereby individual participating states agree to allocate their electors based on the winner of the national popular vote instead of just their respective statewide results.
The presidential election day was established on a Tuesday in the month of November because of the factors involved (weather, harvests and worship). When voters used to travel to the polls by horse, Tuesday was an ideal day because it allowed people to worship on Sunday, ride to their county seat on Monday, and vote on Tuesday—all before market day, Wednesday. The month of November also fits nicely between harvest time and harsh winter weather, which could be especially bad to people traveling by horse and buggy.[12]
Until 1937, presidents were not sworn in until March 4 because it took so long to count and report ballots, and because of the winner's logistical issues of moving to the capital. With better technology and the 20th Amendment being passed, presidential inaugurations were moved to noon on January 20—allowing presidents to start their duties sooner.[12]
The Federal Election Campaign Act of 1971 was enacted to increase disclosure of contributions for federal campaigns. Subsequent amendments to law require that candidates to a federal office must file a Statement of Candidacy with the Federal Election Commission before they can receive contributions aggregating in excess of $5,000 or make expenditures aggregating in excess of $5,000. Thus, this began a trend of presidential candidates declaring their intentions to run as early as the Spring of the previous calendar year so they can start raising and spending the money needed for their nationwide campaign.[5]
The first president, George Washington, was elected as an independent. Since the election of his successor, John Adams, in 1796, all winners of U.S. presidential elections have represented one of two major parties. Third parties have taken second place only twice, in 1860 and 1912. The last time a third (independent) candidate achieved significant success (although still finishing in third place) was in 1992, and the last time a third-party candidate received any electoral votes not from faithless electors was in 1968.
Procedure
Eligibility requirements
The hand-written copy of the natural-born-citizen clause as it appeared in 1787
Article Two of the United States Constitution stipulates that for a person to serve as President, the individual must be a natural-born citizen of the United States, at least 35 years old, and a resident of the United States for a period of no less than 14 years. A candidate may start running his or her campaign early before turning 35 years old or completing 14 years of residency, but must meet the age and residency requirements by Inauguration Day. The Twenty-second Amendment to the Constitution also sets a term limit: a President cannot be elected to more than two terms.
The U.S. Constitution also has two provisions that apply to all federal offices in general, not just the presidency. Article I, Section 3, Clause 7 states that if the U.S. Congress convicts any officer on impeachment, they may also bar that person from holding any public office in the future. And Section 3 of the Fourteenth Amendment prohibits the election to any federal office of any person who had held any federal or state office and then engaged in insurrection, rebellion or treason; this disqualification can be waived if such an individual gains the consent of two-thirds of both houses of Congress.
In addition, the Twelfth Amendment establishes that the Vice-President must meet all of the qualifications of being a President.
Although not a mandatory requirement, Federal campaign finance laws including the Federal Election Campaign Act state that a candidate who intends to receive contributions aggregating in excess of $5,000 or make expenditures aggregating in excess of $5,000, among others, must first file a Statement of Candidacy with the Federal Election Commission.[13] This has led presidential candidates, especially members from the two major political parties, to officially announce their intentions to run as early as the spring of the previous calendar year so they can start raising or spending the money needed for their nationwide campaign.[5] Potential candidates usually form exploratory committees even earlier to determining the feasibility of them actually running.
Nominating process

A 2008 Democratic caucus meeting in Iowa City, Iowa. The Iowa caucuses are traditionally the first major electoral event of presidential primaries and caucuses.
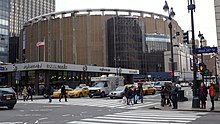
Madison Square Garden in New York City, the site of the 1976, 1980, and 1992 Democratic National Conventions; and the 2004 Republican National Convention.

The floor of the 2008 Republican National Convention at the Xcel Energy Center in Saint Paul, Minnesota.
The modern nominating process of U.S. presidential elections consists of two major parts: a series of presidential primary elections and caucuses held in each state, and the presidential nominating conventions held by each political party. This process was never included in the United States Constitution, and thus evolved over time by the political parties to clear the field of candidates.
The primary elections are run by state and local governments, while the caucuses are organized directly by the political parties. Some states hold only primary elections, some hold only caucuses, and others use a combination of both. These primaries and caucuses are staggered generally between January and June before the federal election, with Iowa and New Hampshire traditionally holding the first presidential state caucus and primary, respectively.
Like the general election, presidential caucuses or primaries are indirect elections. The major political parties officially vote for their presidential candidate at their respective nominating conventions, usually all held in the summer before the federal election. Depending on each state's law and state's political party rules, when voters cast ballots for a candidate in a presidential caucus or primary, they may be voting to award delegates "bound" to vote for a candidate at the presidential nominating conventions, or they may simply be expressing an opinion that the state party is not bound to follow in selecting delegates to their respective national convention.
Unlike the general election, voters in the U.S. territories can also elect delegates to the national conventions. Furthermore, each political party can determine how many delegates to allocate to each state and territory. In 2012 for example, the Democratic and Republican party conventions each used two different formulas to allocate delegates. The Democrats-based theirs on two main factors: the proportion of votes each state gave to the Democratic candidate in the previous three presidential elections, and the number of electoral votes each state had in the Electoral College.[14] In contrast, the Republicans assigned to each state 10 delegates, plus 3 delegates per congressional district.[15] Both parties then gave fixed amounts of delegates to each territory, and finally bonus delegates to states and territories that passed certain criteria.[14][15]
Along with delegates chosen during primaries and caucuses, state and U.S. territory delegations to both the Democratic and Republican party conventions also include "unpledged" delegates that have a vote. For Republicans, they consist of the three top party officials from each state and territory. Democrats have a more expansive group of unpledged delegates called "superdelegates", who are party leaders and elected officials.
Each party's presidential candidate also chooses a vice presidential nominee to run with him or her on the same ticket, and this choice is rubber-stamped by the convention.
If no single candidate has secured a majority of delegates (including both pledged and unpledged), then a "brokered convention" results. All pledged delegates are then "released" and are able to switch their allegiance to a different candidate. Thereafter, the nomination is decided through a process of alternating political horse trading, and additional rounds of re-votes.[16][17][18][19]
The conventions have historically been held inside convention centers, but since the late 20th century both the Democratic and Republican parties have favored sports arenas and domed stadiums to accommodate the increasing attendance.
The popular vote on Election Day

A Texas voter about to mark a selection for president on a ballot, 2008 Election Day
Under the United States Constitution, the manner of choosing electors for the Electoral College is determined by each state's legislature. Although each state designates electors by popular vote, other methods are allowed. For instance, instead of having a popular vote, a number of states used to select presidential electors by a direct vote of the state legislature itself.
However, federal law does specify that all electors must be selected on the same day, which is "the first Tuesday after the first Monday in November," i.e., a Tuesday no earlier than November 2 and no later than November 8.[20] Today, the states and the District of Columbia each conduct their own popular elections on Election Day to help determine their respective slate of electors. Thus, the presidential election is really an amalgamation of separate and simultaneous state elections instead of a single national election run by the federal government.
Like any other election in the United States, the eligibility of an individual for voting is set out in the Constitution and regulated at state level. The Constitution states that suffrage cannot be denied on grounds of race or color, sex or age for citizens eighteen years or older. Beyond these basic qualifications, it is the responsibility of state legislatures to regulate voter eligibility.
Generally, voters are required to vote on a ballot where they select the candidate of their choice. The presidential ballot is a vote "for the electors of a candidate" meaning that the voter is not voting for the candidate, but endorsing a slate of electors pledged to vote for a specific presidential and vice presidential candidate.
Many voting ballots allow a voter to "blanket vote" for all candidates in a particular political party or to select individual candidates on a line by line voting system. Which candidates appear on the voting ticket is determined through a legal process known as ballot access. Usually, the size of the candidate's political party and the results of the major nomination conventions determine who is pre-listed on the presidential ballot. Thus, the presidential election ticket will not list every candidate running for President, but only those who have secured a major party nomination or whose size of their political party warrants having been formally listed. Laws are in effect to have other candidates pre-listed on a ticket, provided that enough voters have endorsed the candidate, usually through a signature list.
The final way to be elected for president is to have one's name written in at the time of election as a write-in candidate. This is used for candidates who did not fulfill the legal requirements to be pre-listed on the voting ticket. It is also used by voters to express a distaste for the listed candidates, by writing in an alternative candidate for president such as Mickey Mouse or comedian Stephen Colbert (whose application was voted down by the South Carolina Democratic Party). In any event, a write-in candidate has never won an election for President of the United States.
Because U.S. territories are not represented in the Electoral College, U.S. citizens in those areas do not vote in the general election for President. Guam has held straw polls for president since the 1980 election to draw attention to this fact.[21]
Electoral college

Electoral College map showing the results of the 2016 U.S. presidential election. Republican candidate Donald Trump won the popular vote in 30 states (denoted in red) to capture 305 electoral votes (plus 1 electoral vote from Maine's second congressional district). Democratic candidate Hillary Clinton won the popular vote in 20 states and Washington, D.C. (denoted in blue) to capture 232 electoral votes.
Most state laws establish a winner-take-all system, wherein the ticket that wins a plurality of votes wins all of that state's allocated electoral votes, and thus has their slate of electors chosen to vote in the Electoral College. Maine and Nebraska do not use this method, instead giving two electoral votes to the statewide winner and one electoral vote to the winner of each Congressional district.
Each state's winning slate of electors then meets at their respective state's capital on the first Monday after the second Wednesday in December to cast their electoral votes on separate ballots for President and Vice President. Although Electoral College members can technically vote for anyone under the U.S. Constitution, 24 states have laws to punish faithless electors,[22] those who do not cast their electoral votes for the person whom they have pledged to elect.
In early January, the total Electoral College vote count is opened by the sitting Vice President, acting in his capacity as President of the Senate, and read aloud to a joint session of the incoming Congress, which was elected at the same time as the President.
If no candidate receives a majority of the electoral vote (at least 270), the President is determined by the rules outlined by the 12th Amendment. Specifically, the selection of President would then be decided by a contingent election in a ballot of the House of Representatives. For the purposes of electing the President, each state has only one vote. A ballot of the Senate is held to choose the Vice President. In this ballot, each senator has one vote. The House of Representatives has chosen the victor of the presidential race only twice, in 1800 and 1824; the Senate has chosen the victor of the vice-presidential race only once, in 1836.
If the President is not chosen by Inauguration Day, the Vice President-elect acts as President. If neither are chosen by then, Congress by law determines who shall act as President, pursuant to the 20th Amendment.
Unless there are faithless electors, disputes, or other controversies, the events in December and January mentioned above are largely a formality since the winner can be determined based on the state-by-state popular vote results. Between the general election and Inauguration Day, this apparent winner is referred to as the "President-elect" (unless it is a sitting President that has won re-election).
Election calendar
The typical periods of the presidential election process are as follows, with the dates corresponding to the 2016 general election:
- Spring 2015 – Candidates announce their intentions to run, and (if necessary) file their Statement of Candidacy with the Federal Election Commission
- August 2015 to March 2016 – Primary and caucus debates
- February 1 to June 14, 2016 – Primaries and caucuses
- April to August, 2016 – Nominating conventions (including those of the minor third parties)
- September and October, 2016 – Presidential election debates
- November 8, 2016 – Election Day
- December 19, 2016 – Electors cast their electoral votes
- January 6, 2017 – Congress counts and certifies the electoral votes
- January 20, 2017 – Inauguration Day
Trends
Previous experience

John Adams was the first of 26 presidents who have been lawyers.
Among the 44 persons who have served as president, only Donald Trump had never held a position in either government or the military prior to taking office.[23] The only previous experience that Zachary Taylor, Ulysses S. Grant, and Dwight D. Eisenhower had was in the military. Herbert Hoover previously served as the Secretary of Commerce. Everyone else served in elected public office before becoming president, such as being Vice President, a member of the United States Congress, or a state or territorial governor.
Fourteen Presidents also served as vice president. However, only John Adams (1796), Thomas Jefferson (1800), Martin Van Buren (1836), Richard Nixon (1968) and George H. W. Bush (1988) began their first term after winning an election. The remaining nine began their first term as president according to the presidential line of succession after the intra-term death or resignation of their predecessor. Of these, Theodore Roosevelt, Calvin Coolidge, Harry S. Truman, and Lyndon B. Johnson were subsequently elected to a full term of their own, while John Tyler, Millard Fillmore, Andrew Johnson, Chester A. Arthur, and Gerald Ford were not. Ford's accession to the presidency is unique in American history in that he became vice president through the process prescribed by the Twenty-fifth Amendment rather than by winning an election, thus making him the only U.S. president to not have been elected to either office.
Sixteen presidents had previously served in the U.S. Senate, including four of the five who served between 1945 and 1974. However, only three were incumbent senators at the time they were elected president (Warren G. Harding in 1920, John F. Kennedy in 1960, and Barack Obama in 2008). Eighteen presidents had earlier served in the House of Representatives. However, only one was a sitting representative when elected to presidency (James A. Garfield in 1880).
Four of the last seven presidents (Jimmy Carter, Ronald Reagan, Bill Clinton and George W. Bush) have been governors of a state. Geographically, these presidents were from either very large states (Reagan from California, Bush from Texas) or from a state south of the Mason–Dixon line and east of Texas (Carter from Georgia, Clinton from Arkansas). In all, sixteen presidents have been former governors, including seven who were incumbent governors at the time of their election to the presidency.
The most common job experience, occupation or profession of U.S. presidents has been lawyer;[24] 26 presidents had served as attorneys. Twenty-two presidents were also in the military. Eight presidents had served as Cabinet Secretaries, with five of the six Presidents who served between 1801 and 1841 having held the office of U.S. Secretary of State.
After leaving office, one president, William Howard Taft, served as Chief Justice of the United States. Two others later served in Congress – John Quincy Adams, who served in the House, and Andrew Johnson, who served in the Senate.
Technology and media
 Play media
Lyndon B. Johnson's 1964 "Daisy" advertisement
Advances in technology and media have also affected presidential campaigns. The invention of both radio and television have given way to the reliance of national political advertisements across those methods of communication. National advertisements such as Lyndon B. Johnson's 1964 commercial "Daisy", Ronald Reagan's 1984 commercial "Morning in America", and George H. W. Bush's 1988 commercial "Revolving Door" became major factors in those respective elections. In 1992, George H. W. Bush's promise of "Read my lips: no new taxes" was extensively used in the commercials of Bill Clinton and Bush's other opponents with significant effect during the campaign.
Since the development of the internet in the mid-90s, Internet activism has also become an invaluable component of presidential campaigns, especially since 2000. The internet was first used in the 1996 presidential elections, but primarily as a brochure for the candidate online.[25] It was only used by a few candidates and there is no evidence of any major effect on the outcomes of that election cycle.[25]
In 2000, both candidates (George W. Bush and Al Gore) created, maintained and updated their campaign website. But it was not until the 2004 presidential election cycle was the potential value of the internet seen. By the summer of 2003, ten people competing in the 2004 presidential election had developed campaign websites.[26]Howard Dean's campaign website from that year was considered a model for all future campaign websites. His website played a significant role in his overall campaign strategy.[26] It allowed his supporters to read about his campaign platform and provide feedback, donate, get involved with the campaign, and connect with other supporters.[25] A Gallup poll from January 2004 revealed that 49 percent of Americans have used the internet to get information about candidates, and 28 percent said that they use the internet to get this information frequently.[25]
In 2008, the internet became a grassroots and a voice of the people tool—a way for the users to connect with each other and with the campaign, like Dean's website had done in 2004. All of the major candidates had a website and utilized social networking like Facebook and MySpace. The popularity of a candidate could be measured by the number of "friends" on these sites as well as on websites like Hitwise, which listed the number of hits all of the presidential candidate's websites had each week.
Internet channels such as YouTube were used by candidates to share speeches and ads for free. This also served as a forum for users to attack other candidates by uploading videos of gaffes.[25]
A study done by the Pew Internet & American Life Project in conjunction with Princeton Survey Research Associates in November 2010 shows that 54 percent of adults in the United States used the internet to get information about the 2010 midterm elections and about specific candidates. This represents 73 percent of adult internet users. The study also showed that 22 percent of adult internet users used social network sites or Twitter to get information about and discuss the elections and 26 percent of all adults used cell phones to learn about or participate in campaigns.[27]
E-campaigning as it has come to be called, is subject to very little regulation. On March 26, 2006, the Federal Election Commission voted unanimously to "not regulate political communication on the Internet, including emails, blogs and the creating of Web sites"[28] This decision made only paid political ads placed on websites subject to campaign finance limitations.[29] A comment was made about this decision by Roger Alan Stone of Advocacy Inc. which explains this loophole in the context of a political campaign: "A wealthy individual could purchase all of the e-mail addresses for registered voters in a congressional district…produce an Internet video ad, and e-mail it along with a link to the campaign contribution page…Not only would this activity not count against any contribution limits or independent expenditure requirements; it would never even need to be reported."[28]
Criticisms
@media all and (max-width:720px){.mw-parser-output .tmulti>.thumbinner{width:100%!important;max-width:none!important}.mw-parser-output .tmulti .tsingle{float:none!important;max-width:none!important;width:100%!important;text-align:center}}
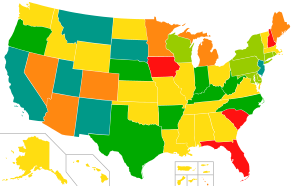
January 2012 (4) February 2012 (7) March 2012 (23) | April 2012 (9) May 2012 (7) June 2012 (6) |

States won by Republican Mitt Romney by 0–4 percentage points
States won by Democrat Barack Obama by 0–4 percentage points
States won by Democrat Barack Obama by 4–8 percentage points
The presidential election process is controversial, with critics arguing that it is inherently undemocratic, and discourages voter participation and turnout in many areas of the country. Because of the staggered nature of the primary season, voters in Iowa, New Hampshire and other small states which traditionally hold their primaries and caucuses first in January usually have a major impact on the races. Campaign activity, media attention, and voter participation are usually higher in these states, as the candidates attempt to build momentum and generate a bandwagon effect in these early primaries. Conversely, voters in California and other large states which traditionally hold their primaries last in June usually end up having no say in who the presidential candidates will be. The races are usually over by then, and thus the campaigns, the media, and voters have little incentive to participate in these late primaries. As a result, more states vie for earlier primaries to claim a greater influence in the process. However, compressing the primary calendar in this way limits the ability of lesser-known candidates to effectively corral resources and raise their visibility among voters, especially when competing with better-known candidates who have more financial resources and the institutional backing of their party's establishment. Primary and caucus reform proposals include a National Primary held on a single day; or the Interregional Primary Plan, where states would be grouped into six regions, and each of the regions would rotate every election on who would hold their primaries first.
With the primary races usually over before June, the political conventions have mostly become scripted, ceremonial affairs. As the drama has left the conventions, and complaints grown that they were scripted and dull pep rallies, public interest and viewership has fallen off. After having offered gavel-to-gavel coverage of the major party conventions in the mid-20th century, the Big Three television networks now only devote approximately three hours of coverage (one hour per night).
Critics also argue that the Electoral College is archaic and inherently undemocratic. With all states, except Maine and Nebraska, using a winner-take-all system, both the Democratic and the Republican candidates are almost certain to win all the electoral votes from those states whose residents predominantly vote for the Democratic Party or the Republican Party, respectively. This encourages presidential candidates to focus exponentially more time, money, and energy campaigning in a few so-called "swing states", states in which no single candidate or party has overwhelming support. Such swing states like Ohio are inundated with campaign visits, saturation television advertising, get-out-the-vote efforts by party organizers, and debates. Meanwhile, candidates and political parties have no incentive to mount nationwide campaign efforts, or work to increase voter turnout, in predominately Democratic Party "safe states" like California or predominately Republican Party "safe states" like Texas. In practice, the winner-take-all system also both reinforces the country's two-party system and decreases the importance of third and minor political parties.[30] Furthermore, a candidate can win the electoral vote without securing the greatest amount of the national popular vote, such as during the 1824, 1876, 1888, 2000 and 2016 elections. In theory, it is possible to secure the necessary 270 electoral votes from only the eleven most populous states and then ignore the rest of the country.
Proposed changes to the election process
In 1844, Representative Samuel F. Vinton of Ohio proposed an amendment to the constitution that would replace the electoral college system with a lot system. The Joint Resolution called for each state to elect, by a simple majority, a presidential candidate of said state. Each state would notify Congress of the presidential election results. Congress would then inscribe the name of every state on uniform balls, equal to the number of said state's members of Congress, and deposit into a box. In a joint session of Congress, a ball would be drawn, and the elected candidate of the state of which is written on the drawn ball would be named President. A second ball would immediately be drawn after, and that state's candidate would be named Vice-President. The resolution did not pass the House. Representative Vinton proposed an identical amendment in 1846. Again, it was unsuccessful. The driving force behind the introduction of the resolution is unclear, as there is no recorded debate for either proposal.[31]
Other constitutional amendments, such as the Every Vote Counts Amendment, have been proposed seeking to replace the Electoral College with a direct popular vote, which proponents argue would increase turnout and participation. Other proposed reforms include the National Popular Vote Interstate Compact, an interstate compact without Congressional authorization, whereby individual participating states agree to allocate their electors based on the winner of the national popular vote, instead of voting their respective statewide results. Another proposal is for every state to simply adopt the District system used by Maine and Nebraska: give two electoral votes to the statewide winner and one electoral vote to the winner of each Congressional district. The Automatic Plan would replace the Electors with an automatic tallying of votes to eliminate the faithless elector affecting the outcome of the election. The Proportional Plan, often compared to the District Plan, would distribute electoral votes in each state in proportion to the popular vote, introducing third party effects in election outcomes. The House Plan would require a constitutional amendment to allocate electors based on the House apportionment alone to lessen small state advantage. Direct election plans and bonus plans have in common a higher valuation on the popular vote for president.[32]
Electoral college results
This is a table of electoral college results. Included are candidates who received at least 1 electoral vote or at least 5% of the popular vote.
| Year | Party | Presidential candidate | Vice presidential candidate | Popular vote | % | Electoral votes | Notes |
|---|---|---|---|---|---|---|---|
1788 | Independent | George Washington | None[33] | 43,782 | 100.0 | 69 / 138 | |
Federalist | John Adams[34] | N/A | N/A | 34 / 138 | |||
John Jay | 9 / 138 | ||||||
Robert H. Harrison | 6 / 138 | ||||||
John Rutledge | 6 / 138 | ||||||
John Hancock | 4 / 138 | ||||||
Anti-Administration | George Clinton | 3 / 138 | |||||
Federalist | Samuel Huntington | 2 / 138 | |||||
John Milton | 2 / 138 | ||||||
James Armstrong | 1 / 138 | ||||||
Benjamin Lincoln | 1 / 138 | ||||||
Anti-Administration | Edward Telfair | 1 / 138 | |||||
1792 | Independent | George Washington | 28,579 | 100.0 | 132 / 264 | ||
Federalist | John Adams[34] | N/A | N/A | 77 / 264 | |||
Democratic-Republican | George Clinton | 50 / 264 | |||||
Thomas Jefferson | 4 / 264 | ||||||
Aaron Burr | 1 / 264 | ||||||
1796 | Federalist | John Adams | 35,726 | 53.4 | 71 / 276 | ||
Democratic-Republican | Thomas Jefferson[35] | 31,115 | 46.6 | 68 / 276 | |||
Federalist | Thomas Pinckney | N/A | N/A | 59 / 276 | |||
Democratic-Republican | Aaron Burr | 30 / 276 | |||||
Samuel Adams | 15 / 276 | ||||||
Federalist | Oliver Ellsworth | 11 / 276 | |||||
Democratic-Republican | George Clinton | 7 / 276 | |||||
Federalist | John Jay | 5 / 276 | |||||
James Iredell | 3 / 276 | ||||||
Independent | George Washington | 2 / 276 | |||||
Democratic-Republican | John Henry | 2 / 276 | |||||
Federalist | Samuel Johnston | 2 / 276 | |||||
Charles Cotesworth Pinckney | 1 / 276 | ||||||
1800 | Democratic-Republican | Thomas Jefferson | Aaron Burr[36] | 41,330 | 61.4% | 73 / 276 | |
Federalist | John Adams | Charles Cotesworth Pinckney[36] | 25,952 | 38.6% | 64 / 276 | ||
John Jay[36] | 1 / 276 | ||||||
1804 | Democratic-Republican | Thomas Jefferson | George Clinton | 104,110 | 72.8% | 162 / 176 | |
Federalist | Charles Cotesworth Pinckney | Rufus King | 38,919 | 27.2% | 14 / 176 | ||
1808 | Democratic-Republican | James Madison | George Clinton | 124,732 | 64.7% | 113 / 176 | [37] |
John Langdon | 9 / 176 | ||||||
Federalist | Charles Cotesworth Pinckney | Rufus King | 62,431 | 32.4% | 47 / 176 | ||
Democratic-Republican | George Clinton | James Madison | N/A | N/A | 3 / 176 | [38] | |
James Monroe | 3 / 176 | ||||||
1812 | Democratic-Republican | James Madison | Elbridge Gerry | 140,431 | 50.4% | 128 / 217 | |
Democratic-Republican/Federalist[39] | DeWitt Clinton | Jared Ingersoll | 132,781 | 47.6% | 86 / 217 | [40] | |
Elbridge Gerry | 3 / 217 | ||||||
1816 | Democratic-Republican | James Monroe | Daniel D. Tompkins | 76,592 | 68.2% | 83 / 217 | |
Federalist | Rufus King | John Eager Howard | 34,740 | 30.9% | 22 / 217 | [41] | |
James Ross | 5 / 217 | ||||||
John Marshall | 4 / 217 | ||||||
Robert Goodloe Harper | 3 / 217 | ||||||
1820 | Democratic-Republican | James Monroe | Daniel D. Tompkins | 87,343 | 80.6% | 218 / 232 | [42] |
Richard Stockton (Federalist) | 8 / 232 | ||||||
Daniel Rodney (Federalist) | 4 / 232 | ||||||
Robert Goodloe Harper (Federalist) | 1 / 232 | ||||||
John Quincy Adams | Richard Rush (Federalist) | N/A | N/A | 1 / 232 | [43] | ||
1824 | Democratic-Republican (Adams faction) | John Quincy Adams[44] | John C. Calhoun | 113,122 | 30.9% | 74 / 261 | [45] |
Andrew Jackson | 9 / 261 | ||||||
| N/A | 1 / 261 | ||||||
Democratic-Republican (Jackson faction) | Andrew Jackson | John C. Calhoun | 151,271 | 41.4% | 99 / 261 | ||
Democratic-Republican (Crawford faction) | William H. Crawford | Nathaniel Macon | 40,856 | 11.2% | 24 / 261 | [46] | |
Martin Van Buren | 9 / 261 | ||||||
John C. Calhoun | 2 / 261 | ||||||
Henry Clay | 2 / 261 | ||||||
Nathan Sanford | 2 / 261 | ||||||
Andrew Jackson | 1 / 261 | ||||||
Democratic-Republican (Clay faction) | Henry Clay | Nathan Sanford | 47,531 | 13.0% | 28 / 261 | [47] | |
John C. Calhoun | 7 / 261 | ||||||
Andrew Jackson | 3 / 261 | ||||||
1828 | Democratic | Andrew Jackson | John C. Calhoun | 642,553 | 56.0% | 171 / 261 | [48] |
William Smith | 7 / 261 | ||||||
National Republican | John Quincy Adams | Richard Rush | 500,897 | 43.6% | 83 / 261 | ||
1832 | Democratic | Andrew Jackson | Martin Van Buren | 701,780 | 54.2% | 189 / 286 | [49] |
William Wilkins | 30 / 286 | ||||||
National Republican | Henry Clay | John Sergeant | 484,205 | 37.4% | 49 / 286 | ||
Nullifier | John Floyd | Henry Lee | N/A | N/A | 11 / 286 | [50] | |
Anti-Masonic | William Wirt | Amos Ellmaker | 100,715 | 7.8% | 7 / 286 | ||
1836 | Democratic | Martin Van Buren | Richard Mentor Johnson | 763,291 | 50.8% | 147 / 294 | [51] |
William Smith | 23 / 294 | ||||||
Whig | William Henry Harrison | Francis Granger | 549,907 | 36.6% | 63 / 294 | [52] | |
John Tyler | 10 / 294 | ||||||
Hugh L. White | John Tyler | 146,107 | 9.7% | 26 / 294 | |||
Daniel Webster | Francis Granger | 41,201 | 2.7% | 14 / 294 | |||
Willie Person Mangum | John Tyler | N/A | N/A | 11 / 294 | [50] | ||
1840 | Whig | William Henry Harrison | John Tyler | 1,275,390 | 52.9% | 234 / 294 | |
Democratic | Martin Van Buren | Richard Mentor Johnson | 1,128,854 | 46.8% | 48 / 294 | [53] | |
Littleton W. Tazewell | 11 / 294 | ||||||
James K. Polk | 1 / 294 | ||||||
1844 | Democratic | James K. Polk | George M. Dallas | 1,339,494 | 49.5% | 170 / 275 | |
Whig | Henry Clay | Theodore Frelinghuysen | 1,300,004 | 48.1% | 105 / 275 | ||
1848 | Whig | Zachary Taylor | Millard Fillmore | 1,361,393 | 47.3% | 163 / 290 | |
Democratic | Lewis Cass | William Orlando Butler | 1,223,460 | 42.5% | 127 / 290 | ||
Free Soil | Martin Van Buren | Charles Francis Adams Sr. | 291,501 | 10.1% | 0 / 290 | ||
1852 | Democratic | Franklin Pierce | William R. King | 1,607,510 | 50.8% | 254 / 296 | |
Whig | Winfield Scott | William Alexander Graham | 1,386,942 | 43.9% | 42 / 296 | ||
Free Soil | John P. Hale | George Washington Julian | 155,210 | 4.9% | 0 / 296 | ||
1856 | Democratic | James Buchanan | John C. Breckinridge | 1,836,072 | 45.3% | 174 / 296 | |
Republican | John C. Frémont | William L. Dayton | 1,342,345 | 33.1% | 114 / 296 | ||
American | Millard Fillmore | Andrew Jackson Donelson | 873,053 | 21.6% | 8 / 296 | ||
1860 | Republican | Abraham Lincoln | Hannibal Hamlin | 1,865,908 | 39.8% | 180 / 303 | |
Democratic (Southern) | John C. Breckinridge | Joseph Lane | 848,019 | 18.1% | 72 / 303 | ||
Constitutional Union | John Bell | Edward Everett | 590,901 | 12.6% | 39 / 303 | ||
Democratic (Northern) | Stephen A. Douglas | Herschel V. Johnson | 1,380,202 | 29.5% | 12 / 303 | ||
1864 | National Union/Republican | Abraham Lincoln | Andrew Johnson | 2,218,388 | 55.0% | 212 / 233 | [54][55] |
Democratic | George B. McClellan | George H. Pendleton | 1,812,807 | 45.0% | 21 / 233 | ||
1868 | Republican | Ulysses S. Grant | Schuyler Colfax | 3,013,650 | 52.7% | 214 / 294 | |
Democratic | Horatio Seymour | Francis Preston Blair Jr. | 2,708,744 | 47.3% | 80 / 294 | ||
1872 | Republican | Ulysses S. Grant | Henry Wilson | 3,598,235 | 55.6% | 286 / 352 | |
Democratic | Thomas A. Hendricks | Benjamin Gratz Brown (Liberal Republican) | 2,834,761[56] | 43.8% | 41 / 352 42 / 352 | [57][58] | |
William S. Groesbeck | 0 / 352 1 / 352 | ||||||
George Washington Julian (Liberal Republican) | 0 / 352 1 / 352 | ||||||
John M. Palmer (Liberal Republican) | 0 / 352 1 / 352 | ||||||
Liberal Republican | Benjamin Gratz Brown | Alfred H. Colquitt (Democratic) | 5 / 352 | [57] | |||
George Washington Julian | 4 / 352 5 / 352 | ||||||
Thomas E. Bramlette (Democratic) | 3 / 352 | ||||||
John M. Palmer | 2 / 352 3 / 352 | ||||||
Nathaniel P. Banks | 1 / 352 | ||||||
Willis Benson Machen (Democratic) | 1 / 352 | ||||||
William S. Groesbeck (Democratic) | 0 / 352 1 / 352 | ||||||
Horace Greeley | Benjamin Gratz Brown | 3 / 352 | [59] | ||||
Democratic | Charles J. Jenkins | Benjamin Gratz Brown | 2 / 352 | ||||
Liberal Republican | David Davis | Benjamin Gratz Brown | 0 / 352 1 / 352 | [57][60] | |||
William S. Groesbeck (Democratic) | 0 / 352 1 / 352 | ||||||
George Washington Julian | 0 / 352 1 / 352 | ||||||
John M. Palmer | 0 / 352 1 / 352 | ||||||
1876 | Republican | Rutherford B. Hayes | William A. Wheeler | 4,034,142 | 47.9% | 185 / 369 | |
Democratic | Samuel J. Tilden | Thomas A. Hendricks | 4,286,808 | 50.9% | 184 / 369 | ||
1880 | Republican | James A. Garfield | Chester A. Arthur | 4,446,158 | 48.3% | 214 / 369 | |
Democratic | Winfield Scott Hancock | William Hayden English | 4,444,260 | 48.3% | 155 / 369 | ||
1884 | Democratic | Grover Cleveland | Thomas A. Hendricks | 4,914,482 | 48.9% | 219 / 401 | |
Republican | James G. Blaine | John A. Logan | 4,856,903 | 48.3% | 182 / 401 | ||
1888 | Republican | Benjamin Harrison | Levi P. Morton | 5,443,892 | 47.8% | 233 / 401 | |
Democratic | Grover Cleveland | Allen G. Thurman | 5,534,488 | 48.6% | 168 / 401 | ||
1892 | Democratic | Grover Cleveland | Adlai Stevenson I | 5,553,898 | 46.0% | 277 / 444 | |
Republican | Benjamin Harrison | Whitelaw Reid | 5,190,819 | 43.0% | 145 / 444 | ||
Populist | James B. Weaver | James G. Field | 1,026,595 | 8.5% | 22 / 444 | ||
1896 | Republican | William McKinley | Garret Hobart | 7,111,607 | 51.0% | 271 / 447 | |
Democratic/Populist | William Jennings Bryan | Arthur Sewall (Democratic) | 6,509,052 | 46.7% | 149 / 447 | [61] | |
Thomas E. Watson (Populist) | 27 / 447 | ||||||
1900 | Republican | William McKinley | Theodore Roosevelt | 7,228,864 | 51.6% | 292 / 447 | |
Democratic | William Jennings Bryan | Adlai Stevenson I | 6,370,932 | 45.5% | 155 / 447 | ||
1904 | Republican | Theodore Roosevelt | Charles W. Fairbanks | 7,630,457 | 56.4% | 336 / 476 | |
Democratic | Alton B. Parker | Henry G. Davis | 5,083,880 | 37.6% | 140 / 476 | ||
1908 | Republican | William Howard Taft | James S. Sherman | 7,678,335 | 51.6% | 321 / 483 | |
Democratic | William Jennings Bryan | John W. Kern | 6,408,979 | 43.0% | 162 / 483 | ||
1912 | Democratic | Woodrow Wilson | Thomas R. Marshall | 6,296,284 | 41.8% | 435 / 531 | |
Progressive | Theodore Roosevelt | Hiram Johnson | 4,122,721 | 27.4% | 88 / 531 | ||
Republican | William Howard Taft | Nicholas Murray Butler[62] | 3,486,242 | 23.2% | 8 / 531 | ||
Socialist | Eugene V. Debs | Emil Seidel | 901,551 | 6.0% | 0 / 531 | ||
1916 | Democratic | Woodrow Wilson | Thomas R. Marshall | 9,126,868 | 49.2% | 277 / 531 | |
Republican | Charles Evans Hughes | Charles W. Fairbanks | 8,548,728 | 46.1% | 254 / 531 | ||
1920 | Republican | Warren G. Harding | Calvin Coolidge | 16,144,093 | 60.3% | 404 / 531 | |
Democratic | James M. Cox | Franklin D. Roosevelt | 9,139,661 | 34.2% | 127 / 531 | ||
1924 | Republican | Calvin Coolidge | Charles G. Dawes | 15,723,789 | 54.0% | 382 / 531 | |
Democratic | John W. Davis | Charles W. Bryan | 8,386,242 | 28.8% | 136 / 531 | ||
Progressive | Robert La Follette | Burton K. Wheeler | 4,831,706 | 16.6% | 13 / 531 | ||
1928 | Republican | Herbert Hoover | Charles Curtis | 21,427,123 | 58.2% | 444 / 531 | |
Democratic | Al Smith | Joseph Taylor Robinson | 15,015,464 | 40.8% | 87 / 531 | ||
1932 | Democratic | Franklin D. Roosevelt | John Nance Garner | 22,821,277 | 57.4% | 472 / 531 | |
Republican | Herbert Hoover | Charles Curtis | 15,761,254 | 39.7% | 59 / 531 | ||
1936 | Democratic | Franklin D. Roosevelt | John Nance Garner | 27,752,648 | 60.8% | 523 / 531 | |
Republican | Alf Landon | Frank Knox | 16,681,862 | 36.5% | 8 / 531 | ||
1940 | Democratic | Franklin D. Roosevelt | Henry A. Wallace | 27,313,945 | 54.7% | 449 / 531 | |
Republican | Wendell Willkie | Charles L. McNary | 22,347,744 | 44.8% | 82 / 531 | ||
1944 | Democratic | Franklin D. Roosevelt | Harry S. Truman | 25,612,916 | 53.4% | 432 / 531 | |
Republican | Thomas E. Dewey | John W. Bricker | 22,017,929 | 45.9% | 99 / 531 | ||
1948 | Democratic | Harry S. Truman | Alben W. Barkley | 24,179,347 | 49.6% | 303 / 531 | |
Republican | Thomas E. Dewey | Earl Warren | 21,991,292 | 45.1% | 189 / 531 | ||
Dixiecrat | Strom Thurmond | Fielding L. Wright | 1,175,930 | 2.4% | 39 / 531 | ||
1952 | Republican | Dwight D. Eisenhower | Richard Nixon | 34,075,529 | 55.2% | 442 / 531 | |
Democratic | Adlai Stevenson II | John Sparkman | 27,375,090 | 44.3% | 89 / 531 | ||
1956 | Republican | Dwight D. Eisenhower | Richard Nixon | 35,579,180 | 57.4% | 457 / 531 | |
Democratic | Adlai Stevenson II | Estes Kefauver | 26,028,028 | 42.0% | 73 / 531 | ||
Walter Burgwyn Jones | Herman Talmadge | N/A | N/A | 1 / 531 | [63] | ||
1960 | Democratic | John F. Kennedy | Lyndon B. Johnson | 34,220,984 | 49.7% | 303 / 537 | |
Republican | Richard Nixon | Henry Cabot Lodge Jr. | 34,108,157 | 49.6% | 219 / 537 | ||
Southern Democratic | Harry F. Byrd | Strom Thurmond | 610,409 | 0.4% | 14 / 537 | [64] | |
Barry Goldwater (Republican) | 1 / 537 | ||||||
1964 | Democratic | Lyndon B. Johnson | Hubert Humphrey | 43,127,041 | 61.0% | 486 / 538 | |
Republican | Barry Goldwater | William E. Miller | 27,175,754 | 38.5% | 52 / 538 | ||
1968 | Republican | Richard Nixon | Spiro Agnew | 31,783,783 | 43.4% | 301 / 538 | |
Democratic | Hubert Humphrey | Edmund Muskie | 31,271,839 | 42.7% | 191 / 538 | ||
American Independent | George Wallace | Curtis LeMay | 9,901,118 | 13.5% | 46 / 538 | ||
1972 | Republican | Richard Nixon | Spiro Agnew | 47,168,710 | 60.7% | 520 / 538 | |
Democratic | George McGovern | Sargent Shriver | 29,173,222 | 37.5% | 17 / 538 | ||
Libertarian | John Hospers | Tonie Nathan | 3,674 | <0.01% | 1 / 538 | [65] | |
1976 | Democratic | Jimmy Carter | Walter Mondale | 40,831,881 | 50.1% | 297 / 538 | |
Republican | Gerald Ford | Bob Dole | 39,148,634 | 48.0% | 240 / 538 | ||
Ronald Reagan | N/A | N/A | 1 / 538 | [66] | |||
1980 | Republican | Ronald Reagan | George H. W. Bush | 43,903,230 | 50.7% | 489 / 538 | |
Democratic | Jimmy Carter | Walter Mondale | 35,480,115 | 41.0% | 49 / 538 | ||
Independent | John B. Anderson | Patrick Lucey | 5,719,850 | 6.6% | 0 / 538 | ||
1984 | Republican | Ronald Reagan | George H. W. Bush | 54,455,472 | 58.8% | 525 / 538 | |
Democratic | Walter Mondale | Geraldine Ferraro | 37,577,352 | 40.6% | 13 / 538 | ||
1988 | Republican | George H. W. Bush | Dan Quayle | 48,886,597 | 53.4% | 426 / 538 | |
Democratic | Michael Dukakis | Lloyd Bentsen | 41,809,476 | 45.6% | 111 / 538 | ||
Lloyd Bentsen | Michael Dukakis | N/A | N/A | 1 / 538 | [67] | ||
1992 | Democratic | Bill Clinton | Al Gore | 44,909,806 | 43.0% | 370 / 538 | |
Republican | George H. W. Bush | Dan Quayle | 39,104,550 | 37.4% | 168 / 538 | ||
Independent | Ross Perot | James Stockdale | 19,743,821 | 18.9% | 0 / 538 | ||
1996 | Democratic | Bill Clinton | Al Gore | 47,401,185 | 49.2% | 379 / 538 | |
Republican | Bob Dole | Jack Kemp | 39,197,469 | 40.7% | 159 / 538 | ||
Reform | Ross Perot | Pat Choate | 8,085,294 | 8.4% | 0 / 538 | ||
2000 | Republican | George W. Bush | Dick Cheney | 50,456,002 | 47.9% | 271 / 538 | |
Democratic | Al Gore | Joe Lieberman | 50,999,897 | 48.4% | 266 / 538 | [68][69] | |
2004 | Republican | George W. Bush | Dick Cheney | 62,040,610 | 50.7% | 286 / 538 | |
Democratic | John Kerry | John Edwards | 59,028,444 | 48.3% | 251 / 538 | ||
John Edwards | 5 | <0.01% | 1 / 538 | [70] | |||
2008 | Democratic | Barack Obama | Joe Biden | 69,498,516 | 52.9% | 365 / 538 | |
Republican | John McCain | Sarah Palin | 59,948,323 | 45.7% | 173 / 538 | ||
2012 | Democratic | Barack Obama | Joe Biden | 65,915,795 | 51.1% | 332 / 538 | |
Republican | Mitt Romney | Paul Ryan | 60,933,504 | 47.2% | 206 / 538 | ||
2016 | Republican | Donald Trump | Mike Pence | 62,979,636 | 46.0% | 304 / 538 | |
Ron Paul (Libertarian)[71] | 124 | <0.01% | 1 / 538 | [72] | |||
Democratic | Hillary Clinton | Tim Kaine | 65,844,610 | 48.1% | 227 / 538 | ||
Republican (cast by Democratic electors) | Colin Powell | Susan Collins | 25 | <0.01% | 1 / 538 | [73] | |
Maria Cantwell (Democratic) | 1 / 538 | ||||||
Elizabeth Warren (Democratic) | 1 / 538 | ||||||
Republican | John Kasich | Carly Fiorina[71] | 2,684 | <0.01% | 1 / 538 | [72] | |
Democratic | Bernie Sanders | Elizabeth Warren | 108,776 | 0.08% | 1 / 538 | [74] | |
Faith Spotted Eagle | Winona LaDuke (Green) | N/A | N/A | 1 / 538 | [75] |
Voter turnout
Voter turnout in the 2004 and 2008 elections showed a noticeable increase over the turnout in 1996 and 2000. Prior to 2004, voter turnout in presidential elections had been decreasing while voter registration, measured in terms of voting age population (VAP) by the U.S. Census, has been increasing. The VAP figure, however, includes persons ineligible to vote – mainly non-citizens and ineligible felons – and excludes overseas eligible voters. Opinion is mixed on whether this decline was due to voter apathy.[76][77][78][79] or an increase in ineligible voters on the rolls.[80]
The difference between these two measures are illustrated by analysis of turnout in the 2004 and 2008 elections. Voter turnout from the 2004 and 2008 election was "not statistically different," based on the voting age population used by a November 2008 U.S. Census survey of 50,000 households.[76] If expressed in terms of vote eligible population (VEP), the 2008 national turnout rate was 61.7% from 131.3 million ballots cast for president, an increase of over 1.6 percentage points over the 60.1% turnout rate of 2004, and the highest since 1968.[81]
Financial disclosures
Prior to 1967, many presidential candidates disclosed assets, stock holdings, and other information which might affect the public trust.[82] In that year, Republican candidate George W. Romney went a step further and released his tax returns for the previous twelve years.[82] Since then, many presidential candidates – including all major-party nominees from 1980 to 2012 – have released some of their returns,[83] although few of the major party nominees have equaled or exceeded George Romney's twelve.[84][85] The Tax History Project – a project directed by Joseph J. Thorndike and established of the nonprofit Tax Analysts group[86] – has compiled the publicly released tax returns of presidents and presidential candidates (including primary candidates).[87]
In 2016, Republican presidential nominee Donald Trump broke with tradition, becoming the only major-party candidate since Gerald Ford in 1976 to not make any of his full tax returns public.[88]Trump gave as a reason that he was being audited by the IRS.[88] However, no law or precedent prevents a person from releasing their tax returns while under audit, and in fact President Richard M. Nixon released his tax returns while being audited.[89][90]
Presidential coattails
Presidential elections are held on the same date as those for all the seats in the United States House of Representatives, the full terms for 33 or 34 of the 100 seats in the United States Senate, the governorships in several U.S. states, and many state and local elections. Presidential candidates tend to bring out supporters who then vote for their party's candidates for those other offices.[91] These other candidates are said to ride on the presidential candidates' coattails. Voter turnout is also generally higher during presidential election years than either midterm election years[92] or odd-numbered election years.[93]
Comparison with other U.S. general elections
| Year | 2016 | 2017 | 2018 | 2019 | 2020 |
|---|---|---|---|---|---|
| Type | Presidential | Off-yeara | Midterm | Off-yearb | Presidential |
President | Yes | No | Yes | ||
| Senate | Class III (34 seats) | No | Class I (33 seats) | No | Class II (33 seats) |
| House | All 435 seats[2] | No | All 435 seats[3] | No | All 435 seats[2] |
| Gubernatorial | 11 states, 2 territories AS, DE, IN, MO, MT, NH, NC, ND, PR, UT, VT, WA, WV | 2 states NJ, VA | 36 states, 3 territories[4] AL, AK, AZ, AR, CA, CO, CT, FL, GA, GU, HI, ID, IL, IA, KS, ME, MP, MD, MA, MI, MN, NE, NV, NH, NM, NY, OH, OK, OR, PA, RI, SC, SD, TN, TX, VI, VT, WI, WY | 3 states KY, LA, MS | 11 states, 2 territories AS, DE, IN, MO, MT, NH, NC, ND, PR, UT, VT, WA, WV |
| Other state and local offices | Varies | ||||
.mw-parser-output .refbegin{font-size:90%;margin-bottom:0.5em}.mw-parser-output .refbegin-hanging-indents>ul{list-style-type:none;margin-left:0}.mw-parser-output .refbegin-hanging-indents>ul>li,.mw-parser-output .refbegin-hanging-indents>dl>dd{margin-left:0;padding-left:3.2em;text-indent:-3.2em;list-style:none}.mw-parser-output .refbegin-100{font-size:100%}
1 This table does not include special elections, which may be held to fill political offices that have become vacant between the regularly scheduled elections.
2 As well as all six non-voting delegates of the U.S. House.
3 As well as five non-voting delegates of the U.S. House. The Resident Commissioner of Puerto Rico instead serves a four-year term that coincides with the presidential term.
4 The Governors of New Hampshire and Vermont are each elected to two-year terms. The other 48 state governors and all five territorial governors serve four-year terms.
See also
- Outline of American politics#Elections
- American election campaigns in the 19th century
- Elections in the United States
First Party System, Federalists vs Jeffersonian Republicans, 1790s-1820s
Second Party System, Democrats vs Whigs, 1830s-1850s
Third Party System, Republicans vs Democrats, 1850s-1890s
Fourth Party System, Republicans vs Democrats, 1890s-1930s; "Progressive Era"
Fifth Party System, Democrats vs Republicans, 1930s-1960s
Sixth Party System, Democrats vs Republicans, 1960s-present
Statistical forecasts:
- Electoral-vote.com
- FiveThirtyEight.com
- PollyVote
- 270towin
Notes
^ Dixon, Robert G., Jr. (1950). "Electoral College Procedure". The Western Political Quarterly. 3 (2). doi:10.2307/443484. JSTOR 443484..mw-parser-output cite.citation{font-style:inherit}.mw-parser-output q{quotes:"""""""'""'"}.mw-parser-output code.cs1-code{color:inherit;background:inherit;border:inherit;padding:inherit}.mw-parser-output .cs1-lock-free a{background:url("//upload.wikimedia.org/wikipedia/commons/thumb/6/65/Lock-green.svg/9px-Lock-green.svg.png")no-repeat;background-position:right .1em center}.mw-parser-output .cs1-lock-limited a,.mw-parser-output .cs1-lock-registration a{background:url("//upload.wikimedia.org/wikipedia/commons/thumb/d/d6/Lock-gray-alt-2.svg/9px-Lock-gray-alt-2.svg.png")no-repeat;background-position:right .1em center}.mw-parser-output .cs1-lock-subscription a{background:url("//upload.wikimedia.org/wikipedia/commons/thumb/a/aa/Lock-red-alt-2.svg/9px-Lock-red-alt-2.svg.png")no-repeat;background-position:right .1em center}.mw-parser-output .cs1-subscription,.mw-parser-output .cs1-registration{color:#555}.mw-parser-output .cs1-subscription span,.mw-parser-output .cs1-registration span{border-bottom:1px dotted;cursor:help}.mw-parser-output .cs1-hidden-error{display:none;font-size:100%}.mw-parser-output .cs1-visible-error{font-size:100%}.mw-parser-output .cs1-subscription,.mw-parser-output .cs1-registration,.mw-parser-output .cs1-format{font-size:95%}.mw-parser-output .cs1-kern-left,.mw-parser-output .cs1-kern-wl-left{padding-left:0.2em}.mw-parser-output .cs1-kern-right,.mw-parser-output .cs1-kern-wl-right{padding-right:0.2em}
^ 3 U.S.C. § 1
^ Caldwell, Leigh Ann (November 4, 2015). "A Viewer's Guide to the Next Year in Presidential Politics". NBC News. Retrieved November 8, 2015.
^ Cohen, Andrew (October 29, 2012). "Could a Hurricane Like Sandy Postpone the Presidential Election?". The Atlantic. Retrieved November 8, 2015.
^ abc Jose A. DelReal (April 3, 2015). "Why Hillary Clinton might have just two more weeks or so to announce she's running for president". Washington Post. Retrieved April 12, 2015.
^ Gary Bugh (2010). Electoral College Reform: Challenges and Possibilities. Ashgate Publishing, Ltd. p. 40. ISBN 978-0-7546-7751-2.
^ Richard A. Epstein, "'In Such Manner as the Legislature Thereof May Direct": The Outcome in Bush v Gore Defended, 68 University of Chicago Law Review 613, 614 (2001).
^ Of the 13 original states during the 1789 election, six states chose electors by some form of popular vote, four states chose electors by a different method, North Carolina and Rhode Island were ineligible to participate since they had not yet ratified the U.S. Constitution, and New York failed to appoint their allotment of electors in time because of a deadlock in their state legislature.
^ ab Mary Beth Norton et al., A People and a Nation: A History of the United States, Vol. I (11th ed. 2019), p. 340.
^ Donald Richard Deskins, Hanes Walton & Sherman C. Puckett, Presidential Elections, 1789–2008: County, State, and National Mapping of Election Data (University of Michigan Press, 2010), p. 117.
^ Rose, Douglas Dana. "The Ten Most Competitive American Presidential Elections". ResearchGate.
^ ab Yan, Holly (6 November 2012). "Why Tuesday, why November, why elephants? Election riddles solved". CNN. Retrieved 9 November 2012.
^ "2016 Presidential Form 2 Filers" (Press release). Federal Election Commission. Retrieved April 12, 2015.
^ ab "Democratic Detailed Delegate Allocation – 2012". The Green Papers. Retrieved September 8, 2015.
^ ab "Republican Detailed Delegate Allocation – 2012". The Green Papers. Retrieved September 8, 2015.
^ Paul, Katie (2008-02-07). "Convention Wisdom". Newsweek.
^ Eun Kyung Kim (2008-02-10). "Convention Q & A". Gannett News Service. Detroit Free Press.
^ Clift, Eleanor (2008-02-06). "A Ticking Clock". Newsweek.
^ Gold, Jeffrey (2008-02-09). "Post-primary questions answered". Associated Press. Courier-Post.
^ "Sandy unlikely to postpone election". USA Today. Retrieved 31 October 2012.
^ "Guam Legislature Moves General Election Presidential Vote to the September Primary". Ballot-Access.org. 2008-07-10. Retrieved 2008-09-17.
^ "Faithless Electors". FairVote.
^ Montanaro, Domenico (April 23, 2017). "Trump's First 100 Days: An 'Entry-Level' Presidency". NPR. Retrieved August 12, 2017.
^ International Law, US Power: The United States' Quest for Legal Security, p. 10, Shirley V. Scott (2012)
^ abcde Pollard, Timothy D.; Chesebro, James W.; Studinski, David Paul (2009). "The Role of the Internet in Presidential Campaigns". Communications Studies. 60 (5): 574–88. doi:10.1080/10510970903260418.
^ ab Endres, Warnick (2004). "Text-based Interactivity in Candidate Campaign Web Sites: A case Study from the 2002 Elections". Western Journal of Communication. 68 (3): 322–42. doi:10.1080/10570310409374804.
^ Smith, Aaron. "Pew Internet & American Life Project". The Internet and Campaign 2010. Pew Research Center.
^ ab Bimbaum, Jeffrey (June 11, 2006). "Loophole a Spigot for E-Mail; Critics Fear Voters Will Be Deluged as Fall Elections Near". The Washington Post.
^ Trent & Friedenberg (2008). Political Campaign Communication Principles & Practices. Lanham, MD: Rowman & Littlefield Publishers, Inc.
^ Jerry Fresia (February 28, 2006). "Third Parties?". Zmag.org. Archived from the original on January 9, 2009. Retrieved August 26, 2010.
^ "House Joint Resolution (H.J. Res.) 8 Proposing a Constitutional Amendment to Elect the President by Lot". National Archives Catalog. Center for Legislative Archives, National Archives and Records Administration.
^ Melcher, James P., "Electing to Reform: Maine and the District Plan for Selection of Presidential Electors", 2004, New England Political Science Association. viewed October 23, 2014.
^ Prior to the ratification of the Twelfth Amendment to the United States Constitution, electors cast two ballots, both for President. The candidate who received a majority of electoral votes became President, and the runner-up became Vice President.
^ ab Adams was elected Vice President.
^ Jefferson was elected Vice President.
^ abc Breakdown by ticket results are available for the 1800 election.
^ In total, Jefferson received 122 electoral votes.
^ Six faithless electors from New York voted for Clinton instead of Madison. Three cast their vice presidential vote for Madison, and three for Monroe.
^ While commonly labeled as the Federalist candidate, Clinton technically ran as a Democratic-Republican and was not nominated by the Federalist party itself, the latter simply deciding not to field a candidate. This did not prevent endorsements from state Federalist parties (such as in Pennsylvania), but he received the endorsement from the New York state Democratic-Republicans as well.
^ Three faithless electors, two from Massachusetts and one from New Hampshire, voted for Gerry for vice president instead of Ingersoll.
^ Electors from Massachusetts voted for Howard, electors from Delaware voted for Harper, and electors from Connecticut split their vote between Ross and Marshall. In total, King received 34 electoral votes.
^ Although the Federalists did not field a candidate, several Federalist electors voted for Federalist vice presidential candidates instead of Tompkins. In total, Monroe received 231 electoral votes.
^ Faithless elector William Plumer of New Hampshire voted for Adams and Rush instead of Monroe and Tompkins.
^ Since no candidate received a majority of the electoral vote, the House of Representatives elected the president. In the House, 13 state delegations voted for Adams, 7 for Jackson, and 4 for Crawford.
^ 74 of Adams' electors voted for Calhoun, 9 voted for Jackson, and one did not vote for vice president.
^ In total, Crawford received 40 electoral votes.
^ In total, Clay received 38 electoral votes.
^ 7 faithless electors from Georgia voted for Smith instead of Calhoun.
^ All 30 of Pennsylvania's electors voted for Wilkins instead of Van Buren. In total, Jackson received 219 electoral votes.
^ ab All of the electoral votes came from South Carolina, where the electors were chosen by the legislature and not by popular vote.
^ All 23 of Virginia's electors voted for Smith for vice president instead of Johnson, which resulted in Johnson failing to obtain a majority of the electoral votes. As a result, the election went to the Senate, which elected Johnson by a vote of 33–16.
^ In total, Harrison received 73 electoral votes.
^ In total, Van Buren received 60 electoral votes.
^ Johnson, a Democrat, was nominated on the National Union ticket along with Lincoln, a Republican.
^ The electoral votes of Tennessee and Louisiana were not counted. Had they been counted, Lincoln would have received 229 electoral votes.
^ All popular votes were originally for Horace Greeley and Benjamin Gratz Brown.
^ abc The used sources had insufficient data to determine the pairings of 4 electoral votes in Missouri. Therefore, the possible tickets are listed with the minimum and maximum possible number of electoral votes each.
^ In total, Hendricks received 42 electoral votes.
^ Greeley died before the Electoral College voted; as a result the electoral vote intended for Greeley and Brown went to several other candidates.
^ In total, Davis received 1 electoral vote.
^ While the Democrats and Populists both nominated Bryan, the two parties had different vice presidential running mates.
^ Butler replaced Sherman, who died before the election was held.
^ W. F. Turner, a faithless elector from Alabama, voted for Jones and Talmadge instead of Stevenson and Kefauver.
^ Unpledged electors voted for Byrd and Thurmond. Henry D. Irwin, a faithless elector from Oklahoma, cast his vote for Byrd and Goldwater instead of Nixon and Lodge.
^ Faithless elector Roger MacBride of Virginia voted for Hospers and Nathan instead of Nixon and Agnew.
^ Mike Padden, a faithless elector from Washington, voted for Reagan instead of Ford. He voted for Dole, however, as pledged.
^ Faithless elector Margarette Leach of West Virginia voted for Bentsen for president and Dukakis for vice president, instead of Dukakis for president and Bentsen for vice president.
^ One of the D.C. electors pledged to Gore-Lieberman abstained from the final vote.
^ "U. S. Electoral College". www.archives.gov.
^ One anonymous faithless elector from Minnesota voted for Edwards for both president and vice president.
^ ab Collins Walsh, Sean (December 19, 2016). "All but 2 Texas members of the Electoral College choose Donald Trump". Austin American-Statesman. Retrieved December 25, 2016.
^ ab 1 faithless electoral vote from Texas.
^ 3 faithless electoral votes from Washington.
^ 1 faithless electoral vote from Hawaii.
^ 1 faithless electoral vote from Washington.
^ ab [1]
^ "National Voter Turnout in Federal Elections: 1960–1996". Federal Election Commission. 2003-07-29. Archived from the original on 2007-12-09. Retrieved 2007-12-09.
^ "Election Information: Election Statistics". Office of the Clerk. Archived from the original on July 25, 2007. Retrieved 2007-12-09.
^ "Voting and Registration Date". U.S. Census Bureau. Retrieved 2007-12-09.
^ "Voter Turnout Frequently Asked Questions". Elections.gmu.edu. March 12, 2009. Archived from the original on 2009-01-22. Retrieved January 24, 2009.
^ "2008 Preliminary Voter Turnout". Elections.gmu.edu. March 12, 2009. Archived from the original on November 13, 2008. Retrieved January 24, 2009.
^ ab Income Tax Returns Released for Last 12 Years by Romney, St. Joseph Gazette, United Press International, November 27, 1967.
^ Shaxson, Nicholas (August 2012). "Where the Money Lives". Vanity Fair.
^ Sherman, Amy (August 19, 2012), Debbie Wasserman Schultz' claim about release of tax returns of major candidates is false, says PolitiFact Florida Archived 2013-02-23 at the Wayback Machine., Miami Herald.
^ Robert Farley, Romney and the Tax Return Precedent, FactCheck.org, Annenberg Public Policy Center, July 19, 2012.
^ About the Project, Tax History Project.
^ Presidential Tax Returns, Tax History Project.
^ ab Alan Rappeport, Donald Trump Breaks With Recent History by Not Releasing Tax Returns, New York Times (May 11, 2016).
^ Jeanne Sahadi, Nixon released his tax returns under audit. Why can't Trump?, CNN Money (May 11, 2016).
^ Sean Gorman, Tim Kaine correctly notes Richard Nixon released tax returns despite audit, PolitiFact (October 5, 2016).
^ "Government By the People; national, state, and local version" Prentice Hall publishers, by Cronin Magleby O'Brien Light
^ Desilver, D. (2014) Voter turnout always drops off for midterm elections, but why? Pew Research Center, July 24, 2014.
^ "Voter Turnout". FairVote. Retrieved 2001-04-08.Low turnout is most pronounced in off-year elections for state legislators and local officials as well as primaries
Further reading
- Schlesinger, Arthur. Jr., ed. History of American Presidential Elections, 1789–2008 (2011) 3 vol and 11 vol editions; detailed analysis of each election, with primary documents; online v. 1. 1789-1824 -- v. 2. 1824-1844 -- v. 3. 1848-1868 -- v. 4. 1872-1888 -- v. 5. 1892-1908 -- v. 6. 1912-1924 -- v. 7. 1928-1940 -- v. 8. 1944-1956 -- v. 9. 1960-1968 -- v. 10. 1972-1984 -- v. 11. 1988-2001
External links
| Wikimedia Commons has media related to United States presidential election. |
- The American Presidency Project (UC Santa Barbara: 52,000+ Presidential Documents)
- Electoral College Box Scores
- Teaching about Presidential Elections
All the maps since 1840 by counties (French language site)- Dave Leip's Atlas of U.S. Presidential Elections
- History of U.S. Presidential Elections: 1789–2004
Graphic election results from 1952 to 2008 broken down by state (Java Applet)
A history of the presidency from the point of view of Vermont Discusses history of American presidential elections with two states as opposite "poles", Vermont, and Alabama- The Living Room Candidate: A Compilation of Presidential Television Ads
- Presidential Elections, from History.com
- A New Nation Votes: American Election Returns 1787–1825
How close were Presidential Elections? – Michael Sheppard, Michigan State University- Better World Links on the U.S. Presidential Election
Presidential Elections: Resource Guides from the Library of Congress
Presidential Elections: Vacancies in Major-Party Candidacies and the Position of President-Elect from Congressional Research Service
U.S. Election Statistics: A Resource Guide from the Library of Congress
 "Electoral Votes". New International Encyclopedia. 1905. This is a tabulation of the electoral votes by election year, and also includes the results for Vice President.
- Statistical forecasts
- Election Projection
- 17 poll composite
- Princeton Election Consortium
- Gallup


